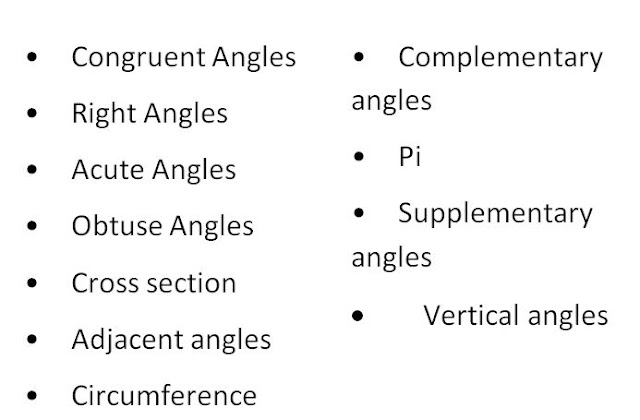
Click these links to identify triangles:
http://www.cliffsnotes.com/study_guide/Classifying-Triangles-by-Sides-or-Angles.topicArticleId-18851,articleId-18785.html
http://www.mathwarehouse.com/geometry/triangles/triangle-types.php
SPANISH/CHINESE
Friday, March 29, 2013
Thursday, March 28, 2013
8th Scatter Plots: Who is better MESSI vs. RONALDO
MESSI VS. RONALDO: WHO IS BETTER?
MESSI/RONALDO VIDEOS
WHO IS BETTER? MESSI VS. RONALDO
Answer the following questions using the scatterplots from MESSI and RONALDO career goals
1. Correlation for Messi from 2004-2008?
2. Correlation for Ronaldo from 2004-2008?
3. Correlation for Messi from 2009-2012?
4. Correlation for Ronaldo from 2009-2012?
5. Messi Goals from 2004-2008?
6. Ronaldo Goals from 2004-2008?
7. Messi Goals from 2009-2012?
8. Ronaldo Goals from 2009-2012?
9. Messi Goals in League play from 2004-2008?
10. Ronaldo Goals in League play from 2004-2008?
11. Messi Goals in League play from 2009-2012?
12. Ronaldo Goals in League play from 2009-2012?
13. Messi Goals in Cup play from 2004-2008?
14. Ronaldo Goals in Cup play from 2004-2008?
15. Messi Goals in Cup play from 2009-2012?
16. Ronaldo Goals in Cup play from 2009-2012?
17. Who had more goals(tiene mas goals?) in Cup play from 2009-2012?
18. Who had more (tiene mas?) Apps(Games Played) from 2004-2008?
19. Who had more (tiene mas?) Apps(Games Playged) from 2009-2012?
20. From 2004-2008 Messi had ____________ Apps(Games Played) and ______________ Goals.
21. From 2004-2008 Ronaldo had ____________ Apps(Games Played) and ______________ Goals.
22. From 2009-2012 Messi had ____________ Apps(Games Payed) and ______________ Goals.
23. From 2009-2012 Ronaldo had ____________ Apps(Games Played) and ______________ Goals.
24. DIVISION: Goals/Apps for Messi 2004-2008
25. DIVISION: Goals/Apps for Ronaldo 2004-2008
26. DIVISION: Goals/Apps for Messi 2009-2012
27. DIVISION: Goals/Apps for Ronaldo 2009-2012
WHO IS BETTER? QUIEN ES MAS MAJOR?
Wednesday, March 27, 2013
3.27 6TH UNIT 5 VOCABULARY PROJECT
CREATE A POWER POINT FOR THE UNIT 5 VOCABULARY WITH THE DEFINITION AND A PICTURE FOR EACH
CLICK EACH TO FIND THE DEFINITION
GEOMETRY
AREA
VOLUME
TWO DIMENSIONAL
THREE DIMENSIONAL
NET
SURFACE AREA
EN ESPANOL
http://www.p12.nysed.gov/biling/docs/ele_3_5_math_spanish.pdf
http://nw.pima.edu/dmeeks/spandict/
http://math2.org/math/spanish/eng-spa.htm
CHINESE
http://www.eudict.com/?lang=engchi&word=math%20terms
http://hua.umf.maine.edu/Chinese/topics/math/douying.html
http://www.p12.nysed.gov/biling/docs/hs_matha_b_chinesesimplified_A_S.pdf
Monday, March 25, 2013
8th 3.25 Scatterplots and Correlation
KEY VOCABULARY: SCATTER PLOT, NEGATIVE CORRELATION, POSITIVE CORRELATION
-VIEW THESE INSTRUCTIONAL VIDEOS
Friday, March 22, 2013
Thursday, March 21, 2013
3.21 6th Unit 4 Review Day
GRAPH THE INEQUALITY
SOLVE AND GRAPH
SET UP AND SOLVE THE ALGEBRA WORD PROBLEMS
Together a puppy and kitten weigh 22 ounces.
The Puppy weighs 12 ounces. Write an equation to represent the combined weight of the puppy and the kitten, k.
The quarterback threw the football
x yards over 4
plays. Write an expression to represent the quarterback’s average yardage per
play.
Juan and Karen weigh 200 pounds together. Karen weighs 70 pounds. How much does Juan j weigh.
Wednesday, March 20, 2013
3.30 8th Unit 6 Vocab Project
You will create a Power Point Slide Show using 1 slide for each term. Each slide must have the word and definition, a design, a picture, and an animation. If you do not find enough information "search" for more information. Click the word to find a definition.
Model Theory
Qualitative Variable
Quantitative Variable
Initial Value
Linear
Non-Linear
Slope
Rate of Change
Bivariate Data
Scatter Plot
Line of Best Fit
Clustering
Outlier
Model Theory
Qualitative Variable
Quantitative Variable
Initial Value
Linear
Non-Linear
Slope
Rate of Change
Bivariate Data
Scatter Plot
Line of Best Fit
Clustering
Outlier
Monday, March 18, 2013
3.21 8th Grade: Evaluate Functions
1. Denise decides to study abroad in France. She has to exchange her
dollars for Euros. The following function describes the exchange rate
between dollars and Euros:
2. The profit from selling s number of t-shirts is described by the following function:
Find p(70).
3. The value of a car is given by the following function:
4. Daniel’s income for the fall semester is described by the following function:
Find ƒ(320)
5. Felix’s total credit card balance is described by the following function:
6. The study time per credit hour is described by the following function.
7. The total amount of gas money is determined by the following function:
What is c($3.00)?
8. The number of students enrolled in the 9 am Calculus class is described by the following function:
9. The number of Facebook friends you make d days after arriving on campus is described by the following function:
10. A mechanic charges $125 plus $25 per hour of labor. The equation c=25n+125 describes the total she would charge for a service visit, where n represents the number of hours of labor and c is the total cost. Graph the equation and using the graph, find how much he charges when she works 3 hours.
11. An airplane whose capacity is 100 passengers is to be chartered for a flight to Europe. The fare is to be $150 per person, if 60 people buy tickets. However, the airline agrees to reduce the fare for ever passenger by $1 for each additional ticket sold. How many tickets should be sold to maximize the ticket revenue for this flight?
12. No more than 65 freshman and sophomores may participate in the math club. There are three times as many freshman as sophmores. Let x represent the number of freshman. Let y represent the number of sophmores. Write and graph an inequality that describes the different number of freshman and sophmores in the math club.
13. Suppose you are at the gas station filling your tank with gas. The function C(g) represents the cost C of filling up the gas tank with g gallons. Given the equation:
C(g)=3.03(g)
a) What does the number 3.03 represent?
b) Find C(2)
c) Find C(9)
d) For the average motorist, name one value for g that would be inappropriate for this function�s purpose. Explain why you chose the number you did.
e) If you were to graph C(g), what would be an appropriate domain? Range? Explain your reasoning.
ƒ(d) = .75d.Find ƒ(200)
2. The profit from selling s number of t-shirts is described by the following function:
p(s) = 8s – 500.
Find p(70).
3. The value of a car is given by the following function:
v(t) = 20,000(.90)t.Find v(1)
4. Daniel’s income for the fall semester is described by the following function:
ƒ(h) = 1,000 + 9h.
Find ƒ(320)
5. Felix’s total credit card balance is described by the following function:
c(p) = p(1.30).What is p(2500)?
6. The study time per credit hour is described by the following function.
s(c) = 3cWhat is s(15)?
7. The total amount of gas money is determined by the following function:
c(g) = 600g/30.
What is c($3.00)?
8. The number of students enrolled in the 9 am Calculus class is described by the following function:
ƒ(p) = 16p.Find ƒ(20).
9. The number of Facebook friends you make d days after arriving on campus is described by the following function:
ƒ(d) = 2d.Find ƒ(7).
10. A mechanic charges $125 plus $25 per hour of labor. The equation c=25n+125 describes the total she would charge for a service visit, where n represents the number of hours of labor and c is the total cost. Graph the equation and using the graph, find how much he charges when she works 3 hours.
11. An airplane whose capacity is 100 passengers is to be chartered for a flight to Europe. The fare is to be $150 per person, if 60 people buy tickets. However, the airline agrees to reduce the fare for ever passenger by $1 for each additional ticket sold. How many tickets should be sold to maximize the ticket revenue for this flight?
12. No more than 65 freshman and sophomores may participate in the math club. There are three times as many freshman as sophmores. Let x represent the number of freshman. Let y represent the number of sophmores. Write and graph an inequality that describes the different number of freshman and sophmores in the math club.
13. Suppose you are at the gas station filling your tank with gas. The function C(g) represents the cost C of filling up the gas tank with g gallons. Given the equation:
C(g)=3.03(g)
a) What does the number 3.03 represent?
b) Find C(2)
c) Find C(9)
d) For the average motorist, name one value for g that would be inappropriate for this function�s purpose. Explain why you chose the number you did.
e) If you were to graph C(g), what would be an appropriate domain? Range? Explain your reasoning.
Wednesday, March 13, 2013
Tuesday, March 12, 2013
Thursday, March 7, 2013
Wednesday, March 6, 2013
3.6 8th unit 4 slope study guide
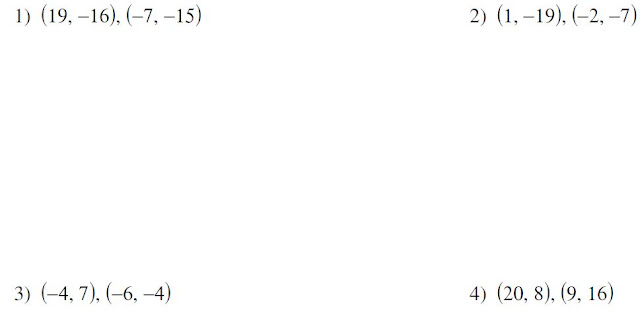
First use the point slope formula y2-y1/x2-x1 to find m(slope):
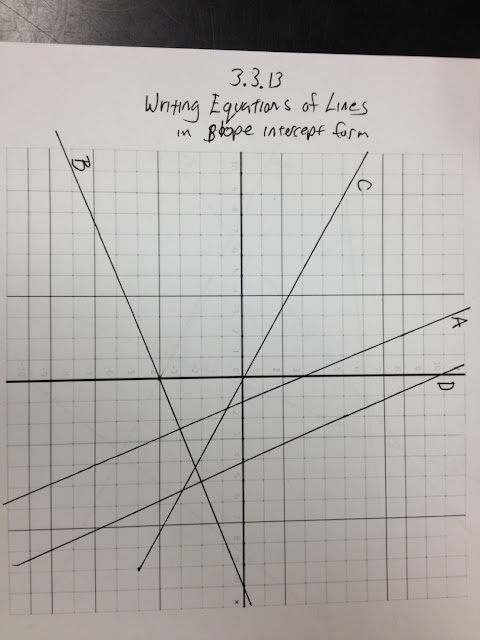
Find the m(slope) and write the equation of the in line y=mx+b
Find the m(slope) y-intercept and line in y=mx+b form:
Find the m(slope) and write the equation of the in line y=mx+b
Find the m(slope) y-intercept and line in y=mx+b form:
Tuesday, March 5, 2013
3.5 6th Algebraic Expression Task
Your worksheet contains several algebraic expressions. Here are the values of each variable you will use to solve:
A=1
B=2
C=3
D=4
E=5
F=6
G=7
H=8
I=9
J=10
K=11
L=12
M=13
N=14
O=15
P=16
Q=17
R=18
S=19
T=20
U=21
V=22
W=23
X=24
Y=25
Z=26
A=1
B=2
C=3
D=4
E=5
F=6
G=7
H=8
I=9
J=10
K=11
L=12
M=13
N=14
O=15
P=16
Q=17
R=18
S=19
T=20
U=21
V=22
W=23
X=24
Y=25
Z=26
Monday, March 4, 2013
3.3 7th Mean,Median, Mode, MAD, Box and Whisker Test Practice
Friday, March 1, 2013
2.29 7th Measures Of Central Tendency Task
Subscribe to:
Posts (Atom)


